Rows
AI-powered platform for simple, natural data analysis
What is Rows?
Try RowsRows is an AI-powered “number crunching sidekick” that turns data from documents and business sources into analysis using natural-language AI tasks. It replaces manual spreadsheet stitching and helps teams work from one all-in-one spreadsheet. You can keep results up to date with automation and collaborate in real time.
What does Rows do for data analysis?
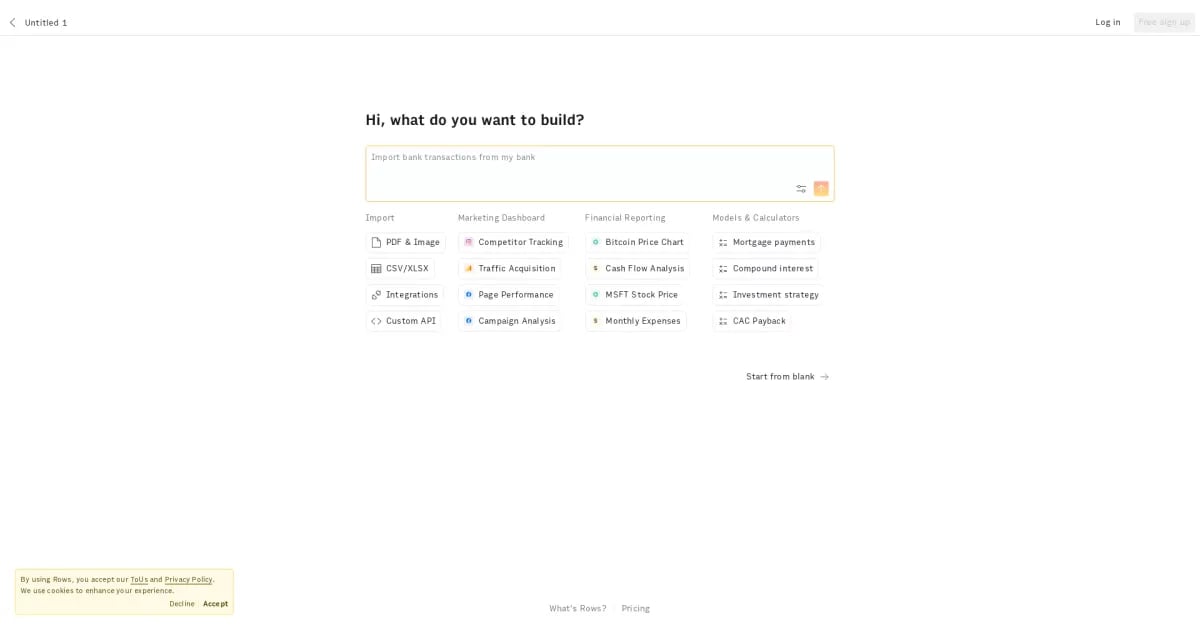
Rows helps you extract data from PDFs and import business data, then analyze it using AI based on what you want to do. Instead of building complex BI workflows or manually stitching spreadsheets, you can create AI-driven tasks that work directly with your data.
Can I use Rows without writing SQL or doing complex spreadsheet work?
Yes. Rows is designed around AI tasks, so you can analyze your data by describing what you want rather than building everything through SQL or complicated spreadsheet steps.
How does the Free plan work, and is it really free?
Yes—Rows offers a Free plan that is free forever, with no trial period and no need for a credit card. You can use it to get started, and switch to a paid plan if you need more AI tasks, automation, integrations, or collaboration.
How many AI tasks, data tables, and integrations do I get on paid plans?
On Plus you get 200 AI tasks per month, automate per day, and up to 10 integrations with up to 10 guests. On Pro you get 1,000 AI tasks per month, automate per minute, up to 100 integrations, and up to 200 guests (plus what’s included per plan). Enterprise offers custom access to data, AI, and APIs for tailored workflows.
Can I automate updates and keep reports current in Rows?
Yes. Rows supports automation with schedules that are plan-dependent, including options to automate per day or even per minute. This helps keep your data and outputs up to date without manual refresh work.
How do sharing and team collaboration work in Rows?
Rows is built for teams with workspaces and member-based collaboration. Depending on your plan, you can add guests and collaborate in real time, and you can share your work across devices as part of your workspace.